
Turn scattered data into useful decisions.
Pipelines, a warehouse, and dashboards that bring your orders, finance, and customer data into one place — with defined metrics and checks so the numbers hold up.
For teams reconciling data across sources or needing reliable decision support.

When this service helps
Data lives in many places
Numbers sit in separate systems, spreadsheets, and exports, so no one view agrees and answering a simple question takes hours.
Reporting is slow and inconsistent
Reports are rebuilt by hand each time and two people pulling the same metric often get two different answers.
No reliable baseline
Without agreed definitions and a single source, you can’t trust a trend or compare one period to another with confidence.
What we can help with
Data Engineering
Design and build the data flows that move, shape, and prepare your data for use.
Data Warehousing
Centralize data from your systems into one queryable, consistent store.
ETL & Data Pipelines
Extract, transform, and load data on a schedule, with validation and exception handling.
Business Intelligence
Model your data and define the metrics teams rely on, so figures are consistent.
Executive Dashboards
Clear dashboards for the people making decisions, built around agreed questions.
Predictive Analytics
Forecasts and models from your historical data — presented with their assumptions and limits.
From sources to decisions
A simple view of how we bring your source data together, check it, store it, and turn it into dashboards you can act on.
Orders, finance, and CRM data flow into ingestion, then validation. Records that pass continue to the warehouse and dashboards; records that fail validation branch to an exception queue for manual review — they are never written silently into the warehouse or the reports. Only validated data reaches the dashboards, and refresh cadence and metric definitions are agreed up front.
You provide
- Your data sources and spreadsheets
- Definitions and the questions to answer
- Review of the metrics
We handle
- Ingestion, cleanup, and validation
- Warehouse and modeling
- Reporting and dashboards
You receive
- Reliable, defined metrics
- Clear dashboards and reports
- An exception process for bad records
How we work
- 1
Define the questions
Agree the decisions and metrics that matter, who the reporting is for, and how each number should be defined.
- 2
Map the sources
Identify where the data lives, confirm access, and check completeness and quality before we build on it.
- 3
Build the pipelines
Set up ingestion, validation, the warehouse, and dashboards, with quality checks and an exception path for bad records.
- 4
Reconcile and review
Compare results against known figures with you, confirm the numbers agree, and hand over with documentation and an agreed refresh schedule.
What you receive
Source & metric definitions
A written record of your data sources and exactly how each metric is calculated, so figures mean the same thing to everyone.
Monitored pipelines with quality checks
Scheduled pipelines into your warehouse, with validation, an exception queue for records that fail, and monitoring on each run.
Dashboards & maintenance guide
The agreed dashboards plus documentation covering refresh cadence, definitions, and how to maintain and extend them.
People responsible for delivery
Illustrative delivery roles for this service — not named staff or promised staffing. Your team is defined in the proposal.
Builds and monitors the ingestion, validation, and warehouse pipelines, including the exception handling.
Defines metrics, checks data quality and completeness, and reconciles results against known figures.
Models the data and builds the dashboards around the decisions and audience we agreed.
Track progress, review changes, and stay aligned through your project portal — projects, milestone progress, published updates, approvals, billing, and messages in one place.
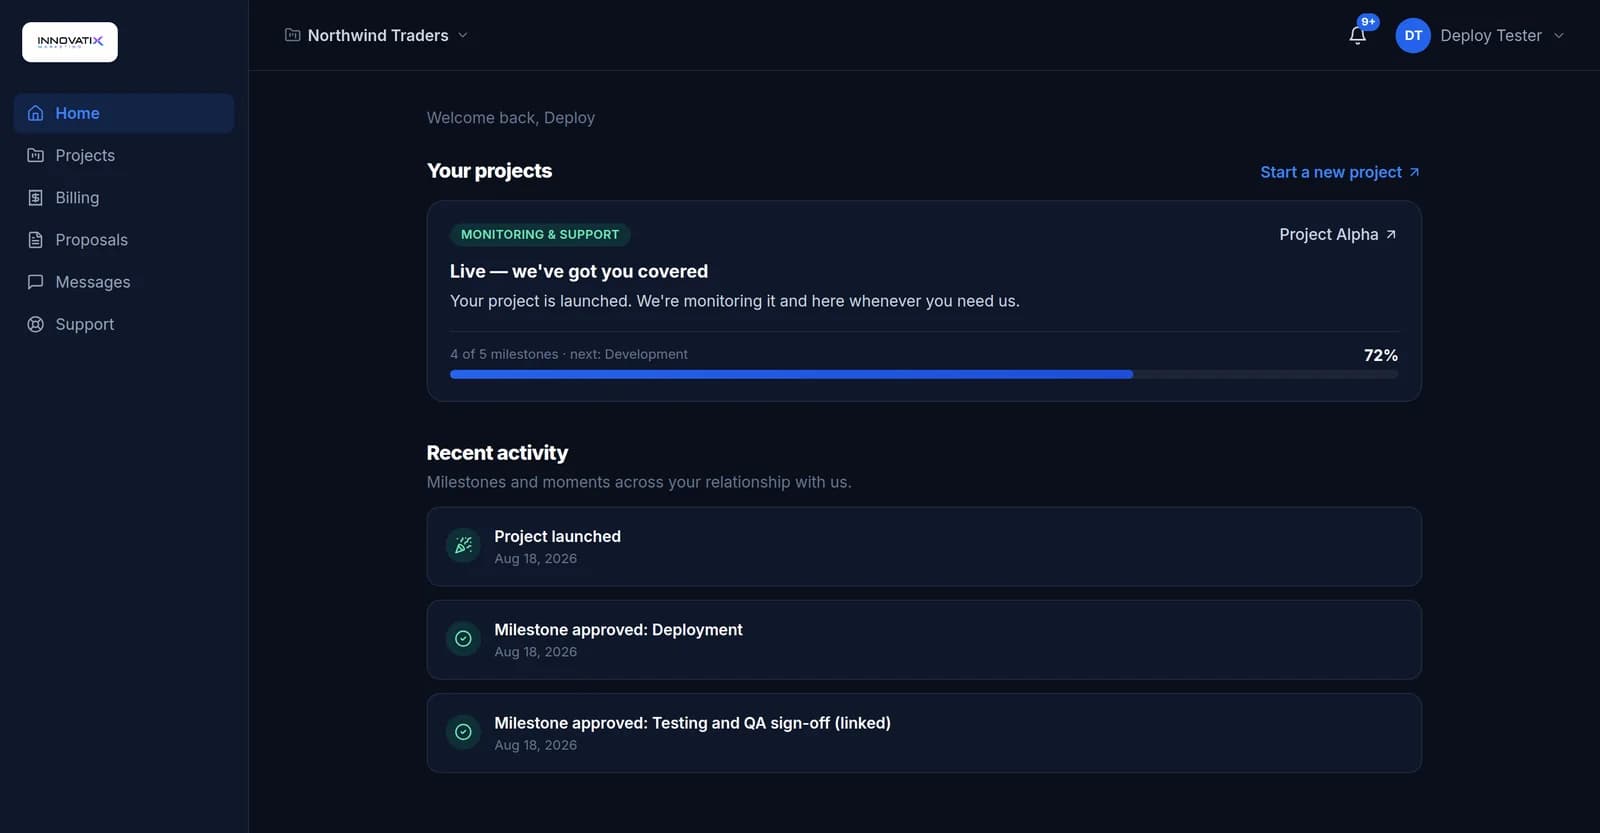 Client portal · demo
Common questions
- Can the dashboards be real time?
- We agree a refresh frequency that fits the data and the decision — some reporting refreshes continuously, some on a schedule such as hourly or daily. We confirm the cadence during scoping rather than assuming real time.
- Can you guarantee the forecasts?
- No. Predictive analytics produces estimates from historical data, presented with their assumptions and limits. We do not guarantee that forecasts will be correct, and we are clear about what a model can and cannot support.
- Do you need direct access to our systems?
- We work through read access or exports at the permission level each source needs, agreed with you. We never collect passwords or payment credentials through the inquiry form.
- Access to your source systems and exports
- How your key metrics should be defined
- Refresh and timeliness expectations
- Known gaps in data completeness or quality
- Who the reporting is for and how it will be used
Tell us the decisions you need data for.
Let’s talk about your sources, the metrics that matter, and the reporting your team can rely on.